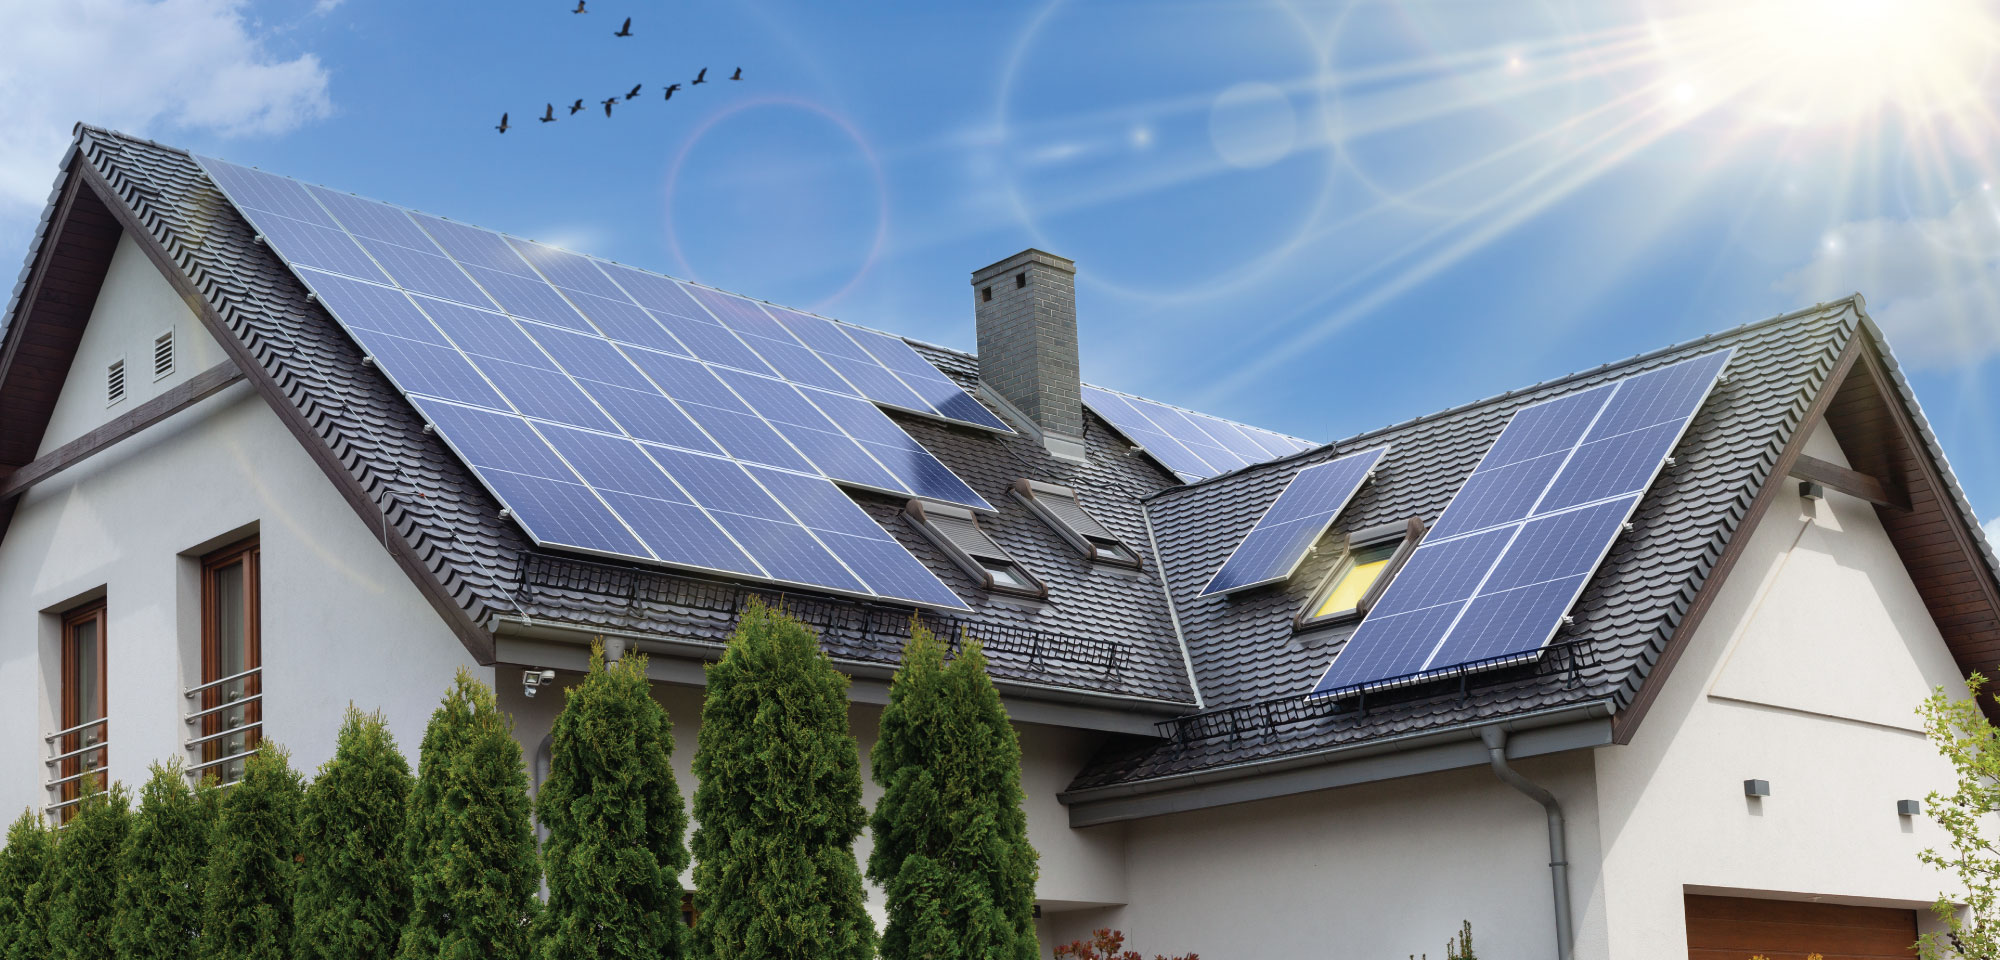
Find out how much solar panels can save on your electric bills
A pretty well-known solar energy fact is that installing solar panels can be a great investment for your home. The average house could save almost $1,500 per year on electricity bills with solar panels! With electricity prices more expensive than ever, homeowners who install solar today can see the best solar savings in decades!
How much you actually save depends on many factors, including your power usage, local electricity rates, the size of your system, and how your utility bills solar customers.
Key takeaways
-
The average 6 kW solar panel system installed anywhere in the country will save you about $1,500 on your electricity bills annually.
-
Solar savings are very real, but exactly how much you save depends on the availability of local, city, and state incentives.
-
A great way to find a reliable solar panel cost estimate near you is by using our solar calculator, which is built using real cost estimates from solar installers.
-
Keep in mind that there is some uncertainty with solar estimates related to utility cost inflation, so actual long-term savings could be slightly lower or slightly higher than what estimates suggest.
-
However, historic trends in utility prices and solar panel performance make us confident in the estimates SolarReviews provides.
How much money can solar panels save you for your specific home?
One of the easiest ways to find out how much you can save with solar panels is by using our solar calculator. SolarReviews has the world’s first solar power calculator that shows the system size that’s right for your home and what your return on investment could look like.
Our calculator provides savings estimates based on the following:
Your location
Your energy usage
Current average price offered by solar companies in your area
We also outline what solar tax incentives and other rebates are available in your area that will help bring down the upfront cost of a solar power system.
How much do solar panels save the average homeowner?
When we talk about solar savings, we are actually talking about avoided energy costs or the amount of money you would have spent on your electric bill had you not installed solar panels on your home.
The average annual electricity consumption for a U.S. residential utility customer is 10,715 kilowatt hours (kWh) per year, which is an average of about 892 kWh per month.
When you multiply that by the national average electricity rate of $0.17 per kWh, you’ll find that the typical American family has a monthly electric bill of around $152. This means if enough solar panels were installed to cover this electricity usage, the average household could save almost $1,820 a year on electric bills!
Here’s a list of the average solar savings that the typical homeowner in each of the state are likely to see for a 7.2 kW, cash-purchased solar energy system on their home:
State | Average electric rate (per kWh) | Estimated annual solar production (kWh) | Estimated annual electric bill savings | Estimated 25-year bill savings |
|---|---|---|---|---|
$0.15 | 13,140 | $1,974.94 | $49,373.55 | |
$0.25 | 7,884 | $2,002.54 | $50,063.40 | |
$0.15 | 19,447 | $2,944.31 | $73,607.65 | |
$0.12 | 11,563 | $1,429.21 | $35,730.29 | |
$0.33 | 16,819 | $5,548.65 | $138,716.35 | |
$0.15 | 15,768 | $2,398.31 | $59,957.82 | |
$0.26 | 10,512 | $2,733.12 | $68,328.00 | |
$0.17 | 11,826 | $2,023.43 | $50,585.72 | |
$0.16 | 14,191 | $2,311.75 | $57,793.66 | |
$0.14 | 13,140 | $1,825.15 | $45,628.65 | |
$0.16 | 13,140 | $2,040.64 | $51,016.05 | |
$0.42 | 13,140 | $5,577.93 | $139,448.25 | |
$0.12 | 11,826 | $1,452.23 | $36,305.82 | |
$0.16 | 10,512 | $1,697.69 | $42,442.20 | |
$0.15 | 11,826 | $1,760.89 | $44,022.29 | |
$0.15 | 14,454 | $2,142.08 | $53,552.07 | |
$0.14 | 11,826 | $1,681.66 | $42,041.43 | |
$0.13 | 13,140 | $1,691.12 | $42,277.95 | |
$0.11 | 10,512 | $1,200.47 | $30,011.76 | |
$0.22 | 11,826 | $2,632.47 | $65,811.69 | |
$0.17 | 11,826 | $2,058.91 | $51,472.67 | |
$0.28 | 10,512 | $2,959.13 | $73,978.20 | |
$0.20 | 11,826 | $2,351.01 | $58,775.22 | |
$0.16 | 13,140 | $2,152.33 | $53,808.30 | |
$0.13 | 11,826 | $1,587.05 | $39,676.23 | |
$0.15 | 11,826 | $1,731.33 | $43,283.16 | |
$0.14 | 13,140 | $1,784.41 | $44,610.30 | |
$0.13 | 18,396 | $2,376.76 | $59,419.08 | |
$0.16 | 10,512 | $1,629.36 | $40,734.00 | |
$0.22 | 11,826 | $2,653.75 | $66,343.86 | |
$0.20 | 18,396 | $3,657.12 | $91,428.12 | |
$0.14 | 10,512 | $1,517.93 | $37,948.32 | |
$0.25 | 11,826 | $2,898.55 | $72,463.82 | |
$0.14 | 11,826 | $1,622.53 | $40,563.18 | |
$0.13 | 10,512 | $1,370.76 | $34,269.12 | |
$0.16 | 14,454 | $2,301.08 | $57,526.92 | |
$0.12 | 13,140 | $1,625.42 | $40,635.45 | |
$0.15 | 10,512 | $1,589.41 | $39,735.36 | |
$0.18 | 10,512 | $1,858.52 | $46,463.04 | |
$0.28 | 13,140 | $3,691.03 | $92,275.65 | |
$0.14 | 13,140 | $1,863.25 | $46,581.30 | |
$0.14 | 11,826 | $1,673.38 | $41,834.48 | |
$0.13 | 15,768 | $1,982.04 | $49,550.94 | |
$0.14 | 17,082 | $2,471.77 | $61,794.14 | |
$0.12 | 10,512 | $1,208.88 | $30,222.00 | |
$0.22 | 11,826 | $2,591.08 | $64,776.92 | |
$0.15 | 11,826 | $1,810.56 | $45,264.02 | |
$0.12 | 10,512 | $1,297.18 | $32,429.52 | |
$0.15 | 11,826 | $1,830.66 | $45,766.62 | |
$0.18 | 14,454 | $2,543.90 | $63,597.60 | |
$0.13 | 14,454 | $1,864.57 | $46,614.15 |
How to find out how much solar panels cost
Another benefit to using our solar calculator is our accurate and live solar installation costs that we get directly from our partner installers.
So not only will you know how much solar can save you, you’ll get an idea of what size solar system you’ll need and how much it’ll cost.
To gauge whether or not solar panels are worth it in your area, be sure to look at the lifetime savings estimates in our calculator reports.
As of 2025, an average 6 kW solar panel installation costs $3.03 per watt. That means the total average cost of the system would come out to about $18,000. The 30% federal tax credit knocks an extra $5,400 or so off the cost, which brings the total down to just about $12,600.
How reliable are solar savings estimates?
We here at SolarReviews are passionate about solar and clean energy and hope that you decide to invest in solar for your home and our planet. However, we are also committed to giving you the full picture so you can make an informed decision.
With that said, it’s important for you to be aware of the limitations of solar saving estimates.
Forecasting residential solar savings can be more difficult than it first appears for two main reasons:
The need for long-term accuracy of solar production estimates in kWh tailored to your location
Accurate economic value of that production after 10, 20, and 25 years (at least)
Figuring out the solar energy production over the lifetime of solar panels is relatively predictable, and solar production in different climates and conditions is well-known and understood. Predicting the future value of solar energy is where it gets tricky.
Most studies have concluded that the price of electricity in the U.S. has gone up by around 3% each year for the past decade. Based on the trends in the past, we can pretty safely assume that the cost of electricity will continue to rise in the future.
So, at SolarReviews, we are confident in our energy bill savings estimations. But you should keep in mind that there is a slight bit of uncertainty when it comes to predicting future utility rates and solar production, so how much you actually save with solar will vary.
The SolarReviews solar savings estimator is here to help you
Going solar is a big decision and it can be hard to know who to trust. At SolarReviews, we’ve dedicated ourselves to giving consumers the most accurate solar estimations possible to help make the switch to solar a little easier.
Catherine is a solar industry analyst and content manager with five years of experience researching and reporting on residential solar. As the former Written Content Manager at SolarReviews, she led a team producing informative content to help homeowners make informed decisions about solar investments. Her expertise has been featured in Solar Today Magazine and Solar Industry Magazine, with insights cited by major outlets including Forbes and Bl...
Learn more about Catherine Lane