Updated 1 year ago
What are Time of Use rates? TOU Explained
Written by
Ben Zientara
Find out what solar panels cost in your area
Time of Use rates are a kind of electricity billing arrangement in which the price of electricity changes based on the time of day.
Electricity prices under Time of Use rate plan are usually cheapest at night and during the middle of the day, and most expensive between 4 and 9 pm on weekdays. These time periods correspond to when there is low vs. high demand for power.
Called “TOU rates” for short, utilities offer these rate plans to encourage people to switch their electricity consumption to times when demand is low. In most places around the country, TOU rates are optional, but people who get solar panels in California are now required to sign up for TOU rates under California Net Billing. The rest of the state’s residents will ultimately be shifted to Time of Use sometime in the future.
Time of Use plans can get quite complicated and confusing, which might sound like the opposite of what you want in an electric bill. But there can be advantages to choosing a TOU rate over a flat rate. If you get solar panels with a battery, you can even shift all your grid usage away from peak times and dramatically lower your bill.
If you have the choice between a flat or TOU plan, this article will tell you what you need to know about which option is right for you, and how you can tailor your electricity use to save money on your energy bills.
Key takeaways
-
Time of Use rates are utility billing arrangements under which electricity is more expensive during times of peak usage and less expensive during off-peak times.
-
Time of Use rates reward people who can shift their energy use to off-peak times.
-
The cheapest time to use electricity is during the night - after most people go to bed, and before they wake up.
-
Solar panels can help save money on Time of Use rates, especially when paired with home battery storage.
-
California is the first state to require homeowners to sign up for a Time of Use rate when they install solar panels.
Why do utility companies use Time of Use rates?
Simply put, utility companies like to use Time of Use rates because they help curb demand when lots of people are using electricity. Reducing that “peak” usage saves the utility money because each kWh of electricity costs a lot more to make during peak times.
Here’s why:
Utilities have a really good idea of the minimum amount of electricity they need to serve their customers at all times. This is called “baseload power,” and it’s really cheap, because the power plants that make it stay operational at all times and maintain high efficiency.
But power usage fluctuates based on weather conditions, temperature, and more. The utilities “book” this fluctuating level of electricity on a weekly and daily basis, and they end up paying a little more for it than they do for baseload power, because starting up extra power plants costs more money.
Finally, during hours of “peak” usage, utilities need to purchase extra energy on shorter time frames: 1 hour ahead, 15 minutes ahead, and even 5 minutes ahead. This is the most expensive kind of electricity.
Under a rate structure where every user pays a flat amount for electricity, the utility makes less of a profit when lots of people use electricity during peak times, because its average cost per kWh goes up while its revenue stays flat.
That’s why utilities invented Time of Use electricity rates.
The differences between Time of Use pricing and standard rates
Most people have a pretty simple electric bill. All month long, they use appliances like the dishwasher and clothes dryer, electronics, light bulbs, water heaters and air conditioners - all of which adds up as total kilowatt-hours (kWh) of usage.
At the end of the month, the utility company sends a bill with a simple calculation: usage multiplied by price.
For example, if you use 1,000 kWh of electricity in a month and your rate is $.15/kWh, you get a bill for $150, plus whatever flat fee your utility charges to connect to the grid—usually something like $5 or $10.
Under TOU rates, you get billed different amounts for usage at different times of day.
How Time of Use rates change with seasons
Electricity usage patterns change from summer to winter, prompting some utilities to offer different rates based on the time of year.
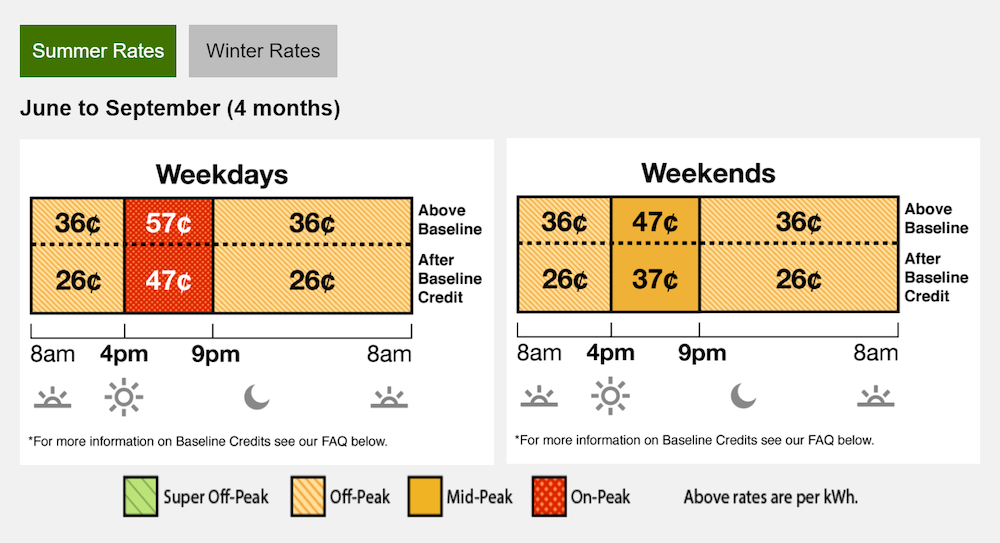
For example, Southern California Edison offers the same rate from 9pm to 4pm the next day during the summer, but raises the price of nighttime electricity in the winter. Here are two screenshots of the SCE website that show the difference:
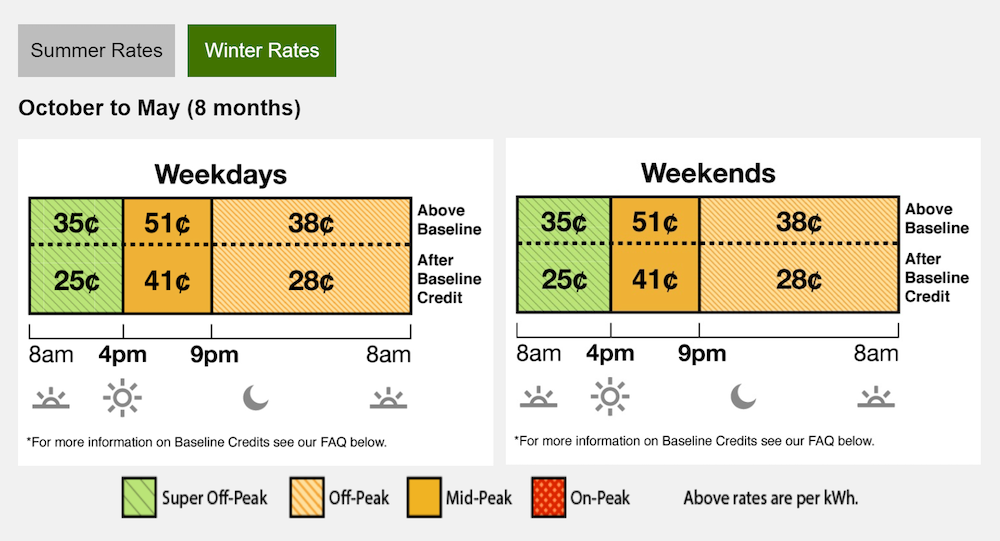
You may notice that in the winter, electricity from 9 pm to 8 am is more expensive than it is from 8 am to 4 pm. This is because people tend to heat their homes more in the winter when they’re at home. In this case, it makes sense to shift most of your wintertime electricity usage to the hours between 8 am and 4 pm if you can.
There are also changes to Time of Use rates on holidays. Because most businesses aren’t operating, there are no peak demand times on holidays like Memorial Day, Labor Day, Thanksgiving Day, Christmas Day, and New Year’s Day.
Incidentally, we originally wrote this article in 2021, and the cost of energy from SCE during summer peak hours has gone up over 38% since then. Electricity is so expensive that going solar is a no-brainer for SCE customers.
Is Time of Use billing worth it?
What makes Time of Use billing a good idea? The answer is: it depends on whether you as an individual consumer can shift enough of your electricity to off-peak times.
Here’s an example: for 2023, SDGE’s actual Time of Use rates are about $0.41, $0.435, and $0.519 for Super Off-Peak, Off-Peak, and On-Peak, respectively (FYI that’s a 50% increase over 2021 prices). Their flat rate for residential customers was a little more than $.45/kWh.
That means if a homeowner used 1,000 kWh per month, they’d be billed $450 on the flat rate. If instead they chose Time of Use billing and used 1/3 of their energy equally on each of the time periods, they’d be billed $455. In order to save a couple dollars over the flat rate, they could shift their energy usage so about half occurred during the Super Off-Peak pricing period.
Seems like a hassle, right? It gets even more complicated when you consider the changes in the cost of electricity when you exceed your baseline usage. Whether you choose a TOU or flat rate plan, the rate goes up by 11.724 cents /kWh after you exceed your baseline allowance.
If you’re a heavy user of electricity compared to other people in your area, a Time of Use rate may save you more money. The key is to check your local utility rates and estimate how much electricity you use during each of the periods.
Something that can help with that last step is the Sense Energy Monitor (or similar), which tracks your energy consumption and can help you decide how to shift your usage or improve energy efficiency. In the near future, energy monitors like Sense will be paired with smart thermostats and energy storage to make your home’s devices automatically work together to reduce your energy costs.
Do solar panels make Time of Use cheaper?
Over the past several years, residential solar systems have popped up on roofs all over the country. Not only is clean energy a great benefit to our environment and neighbors - but it can also help save its owners lots of money.
Solar panels don’t specifically make Time of Use rates cheaper. This is because they tend to generate the most electricity during off-peak periods, when the sun is high in the sky and people are at work instead of using all the appliances in their homes.
That said, adding solar panels to a west-facing roof can benefit people on Time of Use rates, because these types of solar installations generate more energy in the late afternoon and early evening (provided they aren’t shaded by trees or other obstructions).
The solar energy generated goes directly toward reducing your consumption of the most expensive electricity, and kWh sold back to the grid during peak times are worth more if you have a good net metering agreement.
Time of Use rates and home batteries
Some utilities even have special Time of Use rate plans for battery owners, like Southern California Edison, whose “TOU PRIME” rates are just $.24/kWh for off-peak, which is 2 cents/kWh less than their other plans’ cheapest prices.
In this example, a homeowner using 1,000 kWh per month could save as much as $50/month on electricity by adding a battery to their home, with or without solar. Those savings will change a lot when NEM 3 goes into effect in April.
Of course, combining solar panels with batteries gives you both benefits. Your solar panels make electricity far cheaper than buying it from the utility. Your batteries store the energy for later use when your energy usage is high or if you're using energy at night when solar panels can't produce electricity.
You stand to save a lot of money this way.
Ben Zientara is a writer, researcher, and solar policy analyst who has written about the residential solar industry, the electric grid, and state utility policy since 2013. His early work included leading the team that produced the annual State Solar Power Rankings Report for the Solar Power Rocks website from 2015 to 2020. The rankings were utilized and referenced by a diverse mix of policymakers, advocacy groups, and media including The Center...
Learn more about Ben Zientara