Updated 10 hours ago
US Solar Installation Hits Record Pace, Battery Storage Surges
Written by
Deana Barbaro
Find out what solar panels cost in your area
Key takeaways
-
Record Growth: The US solar industry is projected to install over 17 GW of new capacity in 2026, significantly surpassing previous records, driven largely by utility-scale projects.
-
Battery Storage Surge: National residential battery storage attachment rates hit 40%, with California leading at 94% following Net Energy Metering 3.0 changes.
-
Residential Market Shifts: Residential solar installations saw a Q2 2026 decline after the Section 25D tax credit expired, but Q1 showed strong growth.
The US solar industry is marking a new chapter in 2026, with installations projected to reach unprecedented levels. New data from the Solar Energy Industries Association (SEIA) for Q3 2026 indicates the nation is set to install over 17 GW of new solar capacity this year.¹
This pace solidifies a trend of significant growth, even as the residential sector navigates policy changes.
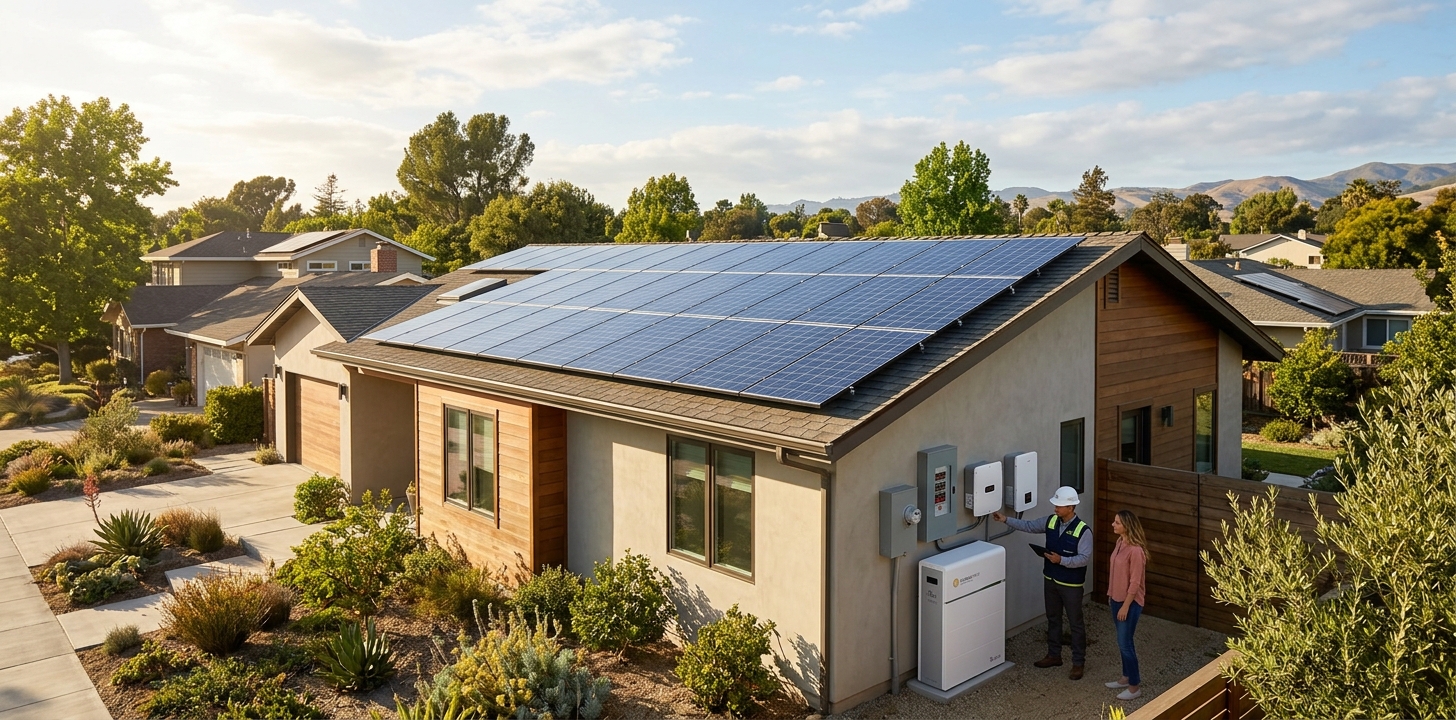
The surge in solar installations is accompanied by a dramatic rise in battery storage adoption. The national residential battery storage attachment rate now stands at 40%.² California notably leads this trend with a 94% attachment rate, a direct response to recent changes in its net metering policies.
Solar Capacity Sets New Records
The U.S. solar industry installed 11.4 gigawatts direct current (GWdc) of capacity in Q2 2026. This marks a substantial increase of 45% from Q2 2025 and 43% compared to Q1 2026. In the first half of 2026 alone, solar power represented 45% of all new electricity-generating capacity added. When combined with battery storage, this figure jumps to 70%¹.
This rapid expansion in solar installations was largely driven by developers. Many pushed to complete "safe-harbored" projects before the July 2026 tax credit eligibility deadline¹. This strategic acceleration has boosted overall capacity additions for the year.
While the total installation numbers are robust, the residential solar segment shows a more nuanced picture. Residential solar installed 995 MWdc in Q2 2026. This represented a 12% year-over-year decline and a 10% quarter-over-quarter drop¹.
This softening is primarily linked to the market adjusting after the Section 25D residential tax credit expired at the end of 2025². Despite this Q2 dip, the residential market experienced 6% year-over-year growth in Q1 2026, making it one of the strongest quarters for residential solar in the past two years, excluding Q4 2025¹.
The SEIA and Wood Mackenzie’s Q3 2026 "Solar Market Insight Report" projects that robust pipelines will support around 44 GWdc of annual additions through 2031. However, factors like permitting challenges and the post-tax-credit transition are expected to keep solar growth flat in some areas despite these strong project pipelines¹.
Battery Storage Takes Center Stage
The U.S. energy storage industry installed a record 20.2 gigawatt-hours (GWh) of new capacity in Q2 2026. This brings the total for the first half of 2026 to 30.8 GWh, marking a 23% year-over-year increase in GWh².
Utility-scale storage led this expansion, accounting for 18 GWh of the Q2 2026 installations. Residential storage added 657 MWh in Q2 2026, while commercial and industrial (C&I) storage contributed 1.8 GWh².
Falling costs for battery systems, coupled with increased demand for reliable electricity, are key drivers behind the overall surge in energy storage installations. Federal and state policy incentives also play a significant role.³
Similar to residential solar, residential battery energy storage system (BESS) deployments saw a 27% year-over-year decrease in MWh additions in Q2 2026. This decline is also attributed to the removal of the 25D incentive and a pull-forward of installations in the previous year².
However, the overall trend for residential battery attachment remains strong. A record 45% of residential solar installations in Q1 2026 were paired with battery storage nationally⁴. This indicates a growing recognition of batteries as an essential component of a solar system. For more information on incentives for solar battery storage, explore available Solar battery incentives.
California's Influence on Battery Adoption
California’s market provides a clear example of how policy changes can accelerate battery adoption. The state's Net Billing Tariff (NEM 3.0) became effective on April 15, 2023, for new solar interconnections with major utilities like PG&E, SCE, and SDG&E. This policy significantly reduced export credits for excess solar electricity, by approximately 75%⁵.
Under the previous NEM 2.0, solar exports earned close to retail rates, roughly $0.30/kWh. With NEM 3.0, these exports now average $0.05-$0.08/kWh outside peak hours. This shift made battery storage "essentially required" or a "critical optimization tool" for maximizing savings in California. Self-consumption of solar energy is now much more valuable than sending it back to the grid in California due to NEM 3.0⁵.
The impact on battery attachment rates has been dramatic. Under NEM 2.0, only about 11% of new California solar installations included a battery. This jumped to over 50% by 2024 and continued to rise in 2026⁵. Some reports even indicate attachment rates reached nearly 70% by the end of 2024⁶. The Q3 2026 figure of 94% highlights the ongoing rapid adoption.
The California Supreme Court declined a final appeal against NEM 3.0 in June 2026, solidifying its legal status⁷. For homeowners in California, a solar-only system under NEM 3.0 typically has a payback period of 9-13 years. However, adding a battery can significantly reduce this to 7-10 years⁵. This financial incentive, combined with demand for reliable power, is driving the high attachment rates.
Outlook for Solar and Storage
The US solar market continues its robust expansion, driven by large-scale projects and strategic development. While the residential sector adjusts to changes in tax credits, the fundamental appeal of solar power, coupled with the increasing value of battery storage, continues to drive demand. This is especially evident in markets like California, where policy has reshaped the solar landscape.
The strong growth in both solar and battery storage capacity demonstrates a clear trend towards a more resilient and decentralized energy grid. This shift also offers new opportunities for solar installers to thrive by adding battery storage installations to their offerings. The ongoing push for renewable energy is improving grid reliability in states like Texas during heatwaves, showcasing the broader benefits of these technologies.
Sources:
Solar Market Insight Report Q3 2026 – SEIA, 2026 (seia.org)
Energy Storage Market Outlook Q3 2026 – SEIA, 2026 (seia.org)
Solar and Storage Industry Research Data – SEIA, 2026 (seia.org)
Solar Market Insight Report Q2 2026 – SEIA, 2026 (seia.org)
NEM 3.0 Explained: What It Means for California Solar in 2026 (caenergysavings.com)
Nem 3 Solar Savings California (californiasolarexit.com)
Nem 3 0 (greenlancer.com)
Deana is a Home Improvement Editor with a passion for helping homeowners navigate renovation, repair, and remodeling with confidence. Specializing in roofing, kitchen and bath remodeling, and outdoor living spaces, she combines industry knowledge with a genuine commitment to making complex home projects feel approachable for readers at every stage of their journey. Her path into home improvement media began after several years working alongside ...
Learn more about Deana Barbaro