Updated 1 year ago
How Much Electricity Prices Increase Per Year in the U.S.
Written by
Ben Zientara
Find out what solar panels cost in your area
According to the U.S. Energy Information Administration (EIA), electricity prices have increased 2.85% per year in the United States for the past 25 years. In 1999, the national average price of electricity was just 8.17 cents per kilowatt-hour (kWh) compared to the 16.48 cents per kWh average today. If you go back to 1960, the average annual rate increase jumps to 2.93%.
Aside from the national average, the rate of increase in electricity prices in each state is also important. Every state has a specific mix of fuel sources and industrial policies that affect the rate of growth, and some states have seen their electricity prices rise much faster than average.
Key takeaways
-
In the U.S., electricity prices have increased by 2.85% per year for the past 25 years.
-
Connecticut, Rhode Island, Massachusetts, Hawaii, and California have the highest annual growth rates, ranging between 3.73% and 4.54%.
-
Louisiana, New Mexico, Iowa, Arizona, and Arkansas have the lowest annual growth rates, with annual increase rates between 1.94% and 2.09%.
-
The rate of increase in electricity prices has been higher in recent years because of increases in fossil fuel prices, the cost of grid upgrades, and repairs from natural disasters.
-
Installing solar panels may be the best way to reduce uncertainty about future electricity prices because estimates of long-term solar production are much more predictable.
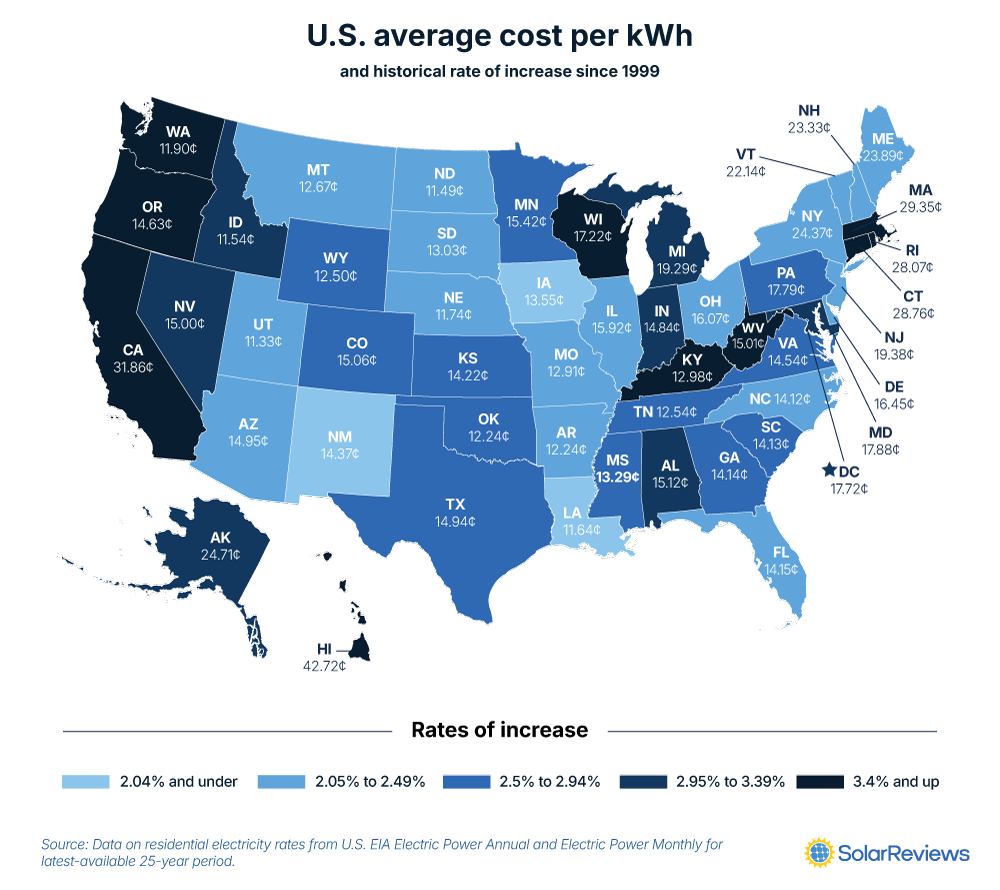
State-by-state increases in electricity rates from 1999-2024
Annual electric rate increases vary quite a bit between states, with 29 states falling below the national average rate of increase and 21 states, plus Washington D.C., exceeding it.
States with the largest average electricity price growth rates: Connecticut, Rhode Island, Massachusetts, Hawaii, and California.
States with the lowest average electricity price growth rates: Louisiana, New Mexico, Iowa, Arizona, and Arkansas.
The map and table below outline the average cost of electricity and annual rates of increase for the latest 25-year period:
State | Annual increase | 1999 Rate (cents/kWh) | 2024 Rate (cents/kWh) |
|---|---|---|---|
California | 4.54% | 10.50 | 31.86 |
Hawaii | 4.53% | 14.10 | 42.72 |
Massachusetts | 4.40% | 10.00 | 29.35 |
Rhode Island | 4.13% | 10.20 | 28.07 |
Connecticut | 3.73% | 11.50 | 28.76 |
Oregon | 3.70% | 5.90 | 14.63 |
West Virginia | 3.56% | 6.30 | 15.10 |
Wisconsin | 3.49% | 7.30 | 17.22 |
Washington | 3.45% | 5.10 | 11.90 |
Kentucky | 3.42% | 5.60 | 12.98 |
District of Columbia | 3.23% | 8.00 | 17.72 |
Alaska | 3.22% | 11.20 | 24.71 |
Michigan | 3.19% | 8.80 | 19.29 |
Idaho | 3.16% | 5.30 | 11.54 |
Alabama | 3.07% | 7.10 | 15.12 |
Maryland | 3.07% | 8.40 | 17.88 |
Nevada | 3.04% | 7.10 | 15.00 |
Indiana | 2.99% | 7.10 | 14.84 |
Minnesota | 2.93% | 7.50 | 15.42 |
Mississippi | 2.90% | 6.50 | 13.29 |
Colorado | 2.88% | 7.40 | 15.06 |
Pennsylvania | 2.81% | 8.90 | 17.79 |
Tennessee | 2.79% | 6.30 | 12.54 |
Texas | 2.74% | 7.60 | 14.94 |
Wyoming | 2.71% | 6.40 | 12.50 |
Virginia | 2.68% | 7.50 | 14.54 |
Georgia | 2.57% | 7.50 | 14.14 |
Kansas | 2.54% | 7.60 | 14.22 |
South Carolina | 2.51% | 7.60 | 14.13 |
Oklahoma | 2.50% | 6.60 | 12.24 |
Illinois | 2.49% | 8.60 | 15.92 |
Ohio | 2.48% | 8.70 | 16.07 |
Delaware | 2.44% | 9.00 | 16.45 |
Utah | 2.44% | 6.20 | 11.33 |
Maine | 2.43% | 13.10 | 23.89 |
Missouri | 2.42% | 7.10 | 12.91 |
Florida | 2.41% | 7.80 | 14.15 |
Nebraska | 2.39% | 6.50 | 11.74 |
Vermont | 2.38% | 12.30 | 22.14 |
North Dakota | 2.30% | 6.50 | 11.49 |
Montana | 2.29% | 7.20 | 12.67 |
South Dakota | 2.29% | 7.40 | 13.03 |
New York | 2.27% | 13.90 | 24.37 |
North Carolina | 2.25% | 8.10 | 14.12 |
New Jersey | 2.11% | 11.50 | 19.38 |
Arkansas | 2.09% | 7.30 | 12.24 |
New Hampshire | 2.09% | 13.90 | 23.33 |
Arizona | 2.05% | 9.00 | 14.95 |
Iowa | 2.03% | 8.20 | 13.55 |
New Mexico | 2.03% | 8.70 | 14.37 |
Louisiana | 1.94% | 7.20 | 11.64 |
U.S. Average | 2.85% | 8.17 | 16.48 |
Data on residential electricity rates from the U.S. EIA Electric Power Annual and Electric Power Monthly for the latest available 25-year period.
Factors that could affect future electricity prices
As they say in the investing industry, “Past performance is no guarantee of future results.” When it comes to the cost of electricity, many people think the historical rate of increase is too low, given the current challenges of climate change and fluctuations in fossil fuel pricing.
There has been a huge upheaval in energy prices over the past few years. The nationwide average electricity price increased nearly 11% from 2021 to 2022, but growth slowed to 5.69% in 2023 and 3.13% in 2024. So things look like they could be settling down.
Many of these large increases were driven by significant world events. In early 2020, oil and natural gas prices dipped due to the pandemic, but then skyrocketed due to the war between Russia and Ukraine and economy-wide inflation.
Will these huge increases in price return, going against 60-plus years of data? Probably not. Increases in renewable energy sources will likely have a moderating effect in the long term, but electrical grid upgrades and increased demand brought on by AI data centers could also increase prices in the short term.
Why the rate of increase is important to know
It’s important to know the historical rate of increase in electricity prices if you’re trying to estimate how much you might save by installing solar panels.
Solar panels help protect you from steep electricity rate increases, and is one of the best ways to see savings on your electricity bills. In fact, when your utility raises rates, you start saving more when you have solar panels on your roof.
It’s also a key fact to know when you’re comparing solar quotes from installers. Quotes will include lifetime savings estimates for the system they propose, but sometimes installers will overestimate electricity rate increases to make solar sound like a better deal to you.
Take a look at this video that shows how the same solar system changes from a good deal to a so-so one, just by changing the rate of utility cost increase:
Final word on rate increases
People go solar to save money on their electricity bills. The good news is that as long as your solar panels are making electricity, you’ll be saving money.
How much money you will save has a lot to do with how much electricity prices go up over time, and given historical rates of increase, it looks like most folks can expect that to be around 2.8% per year.
However, energy prices in some states have historically risen by more than 2.8%, so be sure to check your state in the list above.
If you’re considering solar panels for your home, one of the biggest uncertainties is the future price of electricity from your utility company. Solar panels will make electricity for 25 years or more, so having a good estimate of the costs they will offset is vital in deciding whether home solar is a good investment for you.
Ben Zientara is a writer, researcher, and solar policy analyst who has written about the residential solar industry, the electric grid, and state utility policy since 2013. His early work included leading the team that produced the annual State Solar Power Rankings Report for the Solar Power Rocks website from 2015 to 2020. The rankings were utilized and referenced by a diverse mix of policymakers, advocacy groups, and media including The Center...
Learn more about Ben Zientara